Polling 3.0
by Thomson Reuters
A high-performance tool for conducting industry leading financial market polls on instruments including economic indicators, foreign exchange rates, and interest rates.
Project Check
Tools: Sketch, Adobe Photoshop, Storybook, Balsamiq
Team: 1 UX designer, 7 developers, 1 project manager
My Role: UX design, UX research, UI/Visual Design, Workshop facilitation
Timeline: Overall: 20 weeks - Discovery & Research: 3+ weeks on an iteration basis
Overview
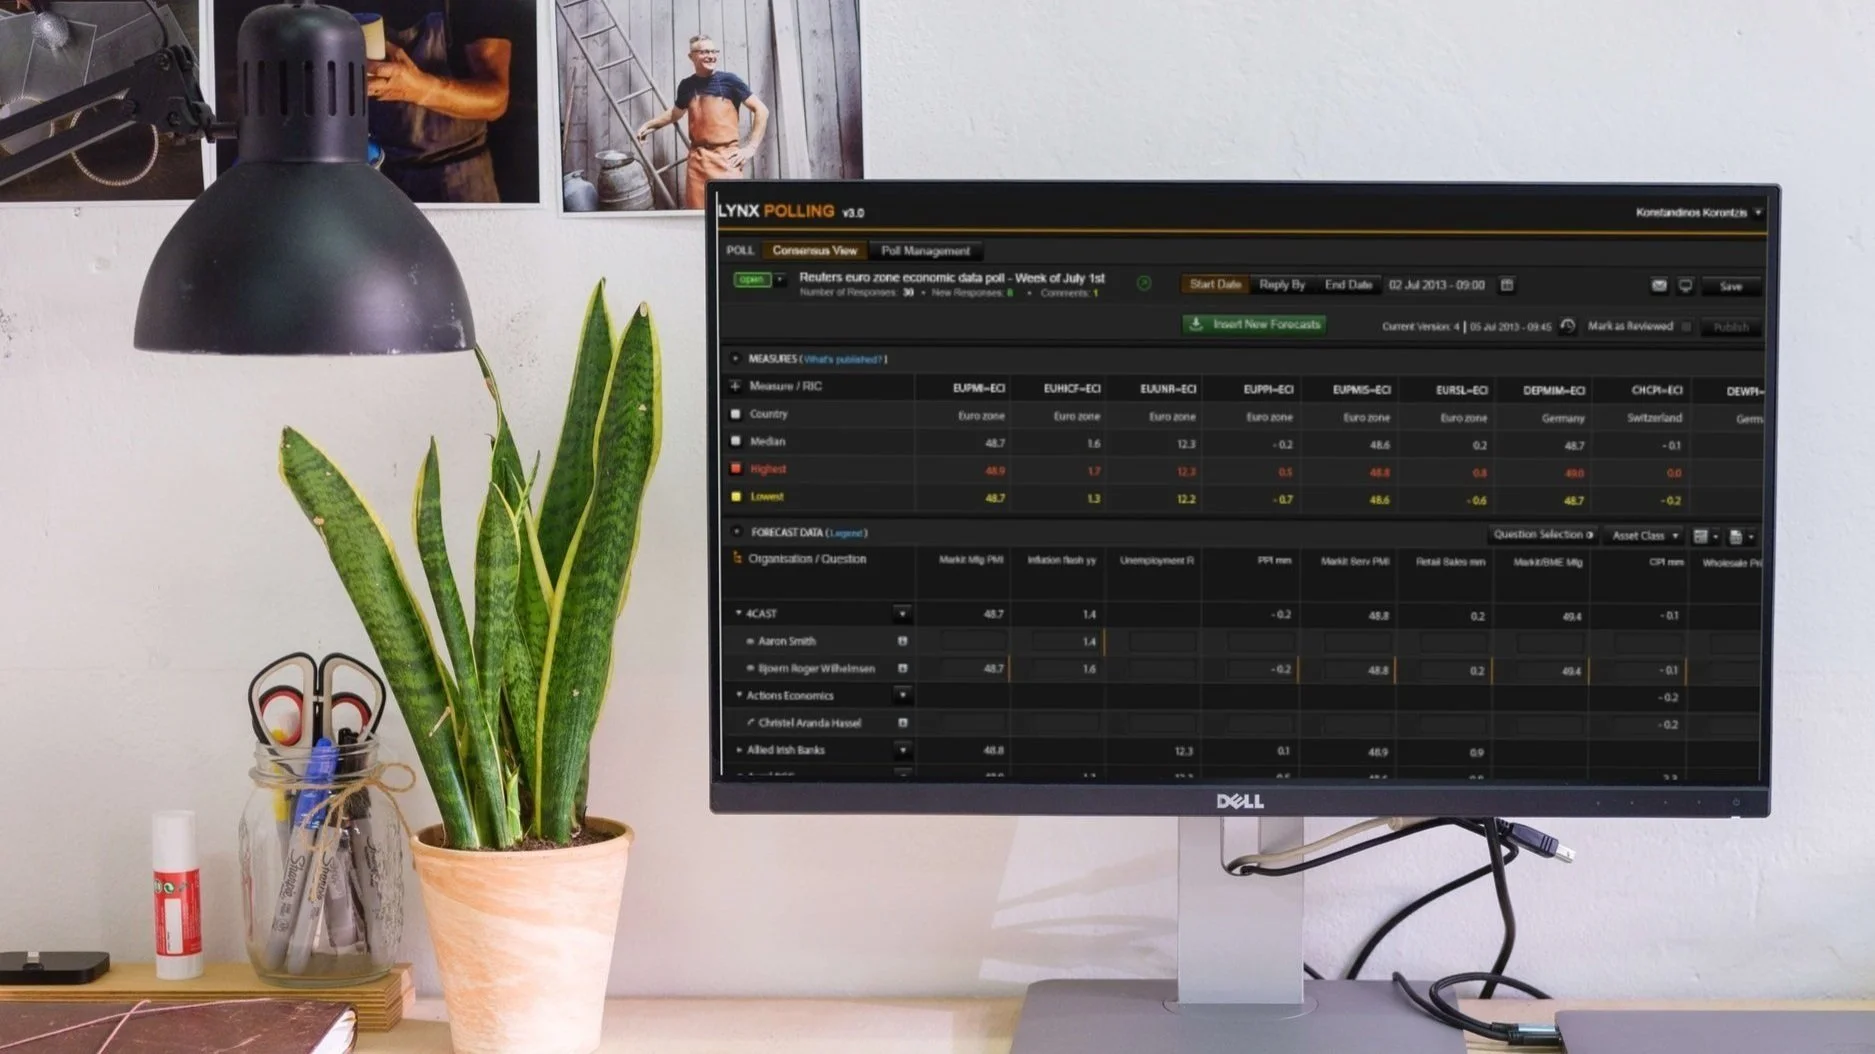
Polling 3.0 - a Thomson Reuters proprietary tool - is a high-performance tool for conducting industry leading financial market polls on instruments including economic indicators, foreign exchange rates, and interest rates. It was launched in November 2014 to replace an ageing and labour intensive system with brand new software designed to collect forecasts from leading global economists using a back end management system and end user advanced web questionnaire system embedded with forecast algorithms.
The Challenge
To provide an overhaul of a true Platform capability for Editorial users to conduct Polling that can support the expansion of poll asset classes and questions, as well as engaging with more users, using a customer/user-led approach.
The Key Goals of the project:
Deliver a configurable, template driven UX/UI enabling the editorial Pollsters to build their polls once and use them many times
Design an online collections portal, enabling respondents to enter all their forecasts into a simple UI from their PC or tablet
Design a set of capabilities that automate and simplify the processing, validation and calculation of values prior to publication
Streamline the editorial workflow, reducing time and overall latency for each function
Eliminate repetitive work wherever possible
My Design Process

Discovery
Due to the huge complexity of the system, my first step was to analyse, evaluate and redefine where necessary the scope and requirements of the project. With over 190+ requirements I wanted to make sure these are grouped into sprints working alongside the project manager with clear OKR's.
This process also required doing an analysis on various parts of the system, including hierarchy and user roles archetypes on the current system and back end architecture.

Research
Prior to creating any early wireframe, I employed a variety of research methods to validate the requirement as well as understand better the pain point of users and make any decisions based on the ability to streamline their workflow.
I used the following methods:
User interviews
Demographic and Ethnographic Research
Personas

Workshops & Wireframes

I lead and run a number of user and stakeholder workshops to identify and improve user journeys throughout their creation. The workshops also included further identification on interaction design, amongst key stakeholders and developers to understand better the method of implementation and technology approach.
Each workshop was followed by a numerous of wireframes to validate against the discovery and research and make sure that all key requirements were covered and prioritised on the different sections.

First Design Iterations
Inventory and flow
Through iterations I was continually running an inventory which assisted in two key areas:
Understand and review with users, stakeholders and engineers the sufficient workflows
Group and prioritise the necessary sprints as well as re-design any screens that were not satisfactory from user testing.
Therefore I created a few flow charts and inventories detailing the process of how from dashboard to questionnaire creation to data analysis a user would successfully and simply post polls to third party users.
High Fidelity
Design & UI
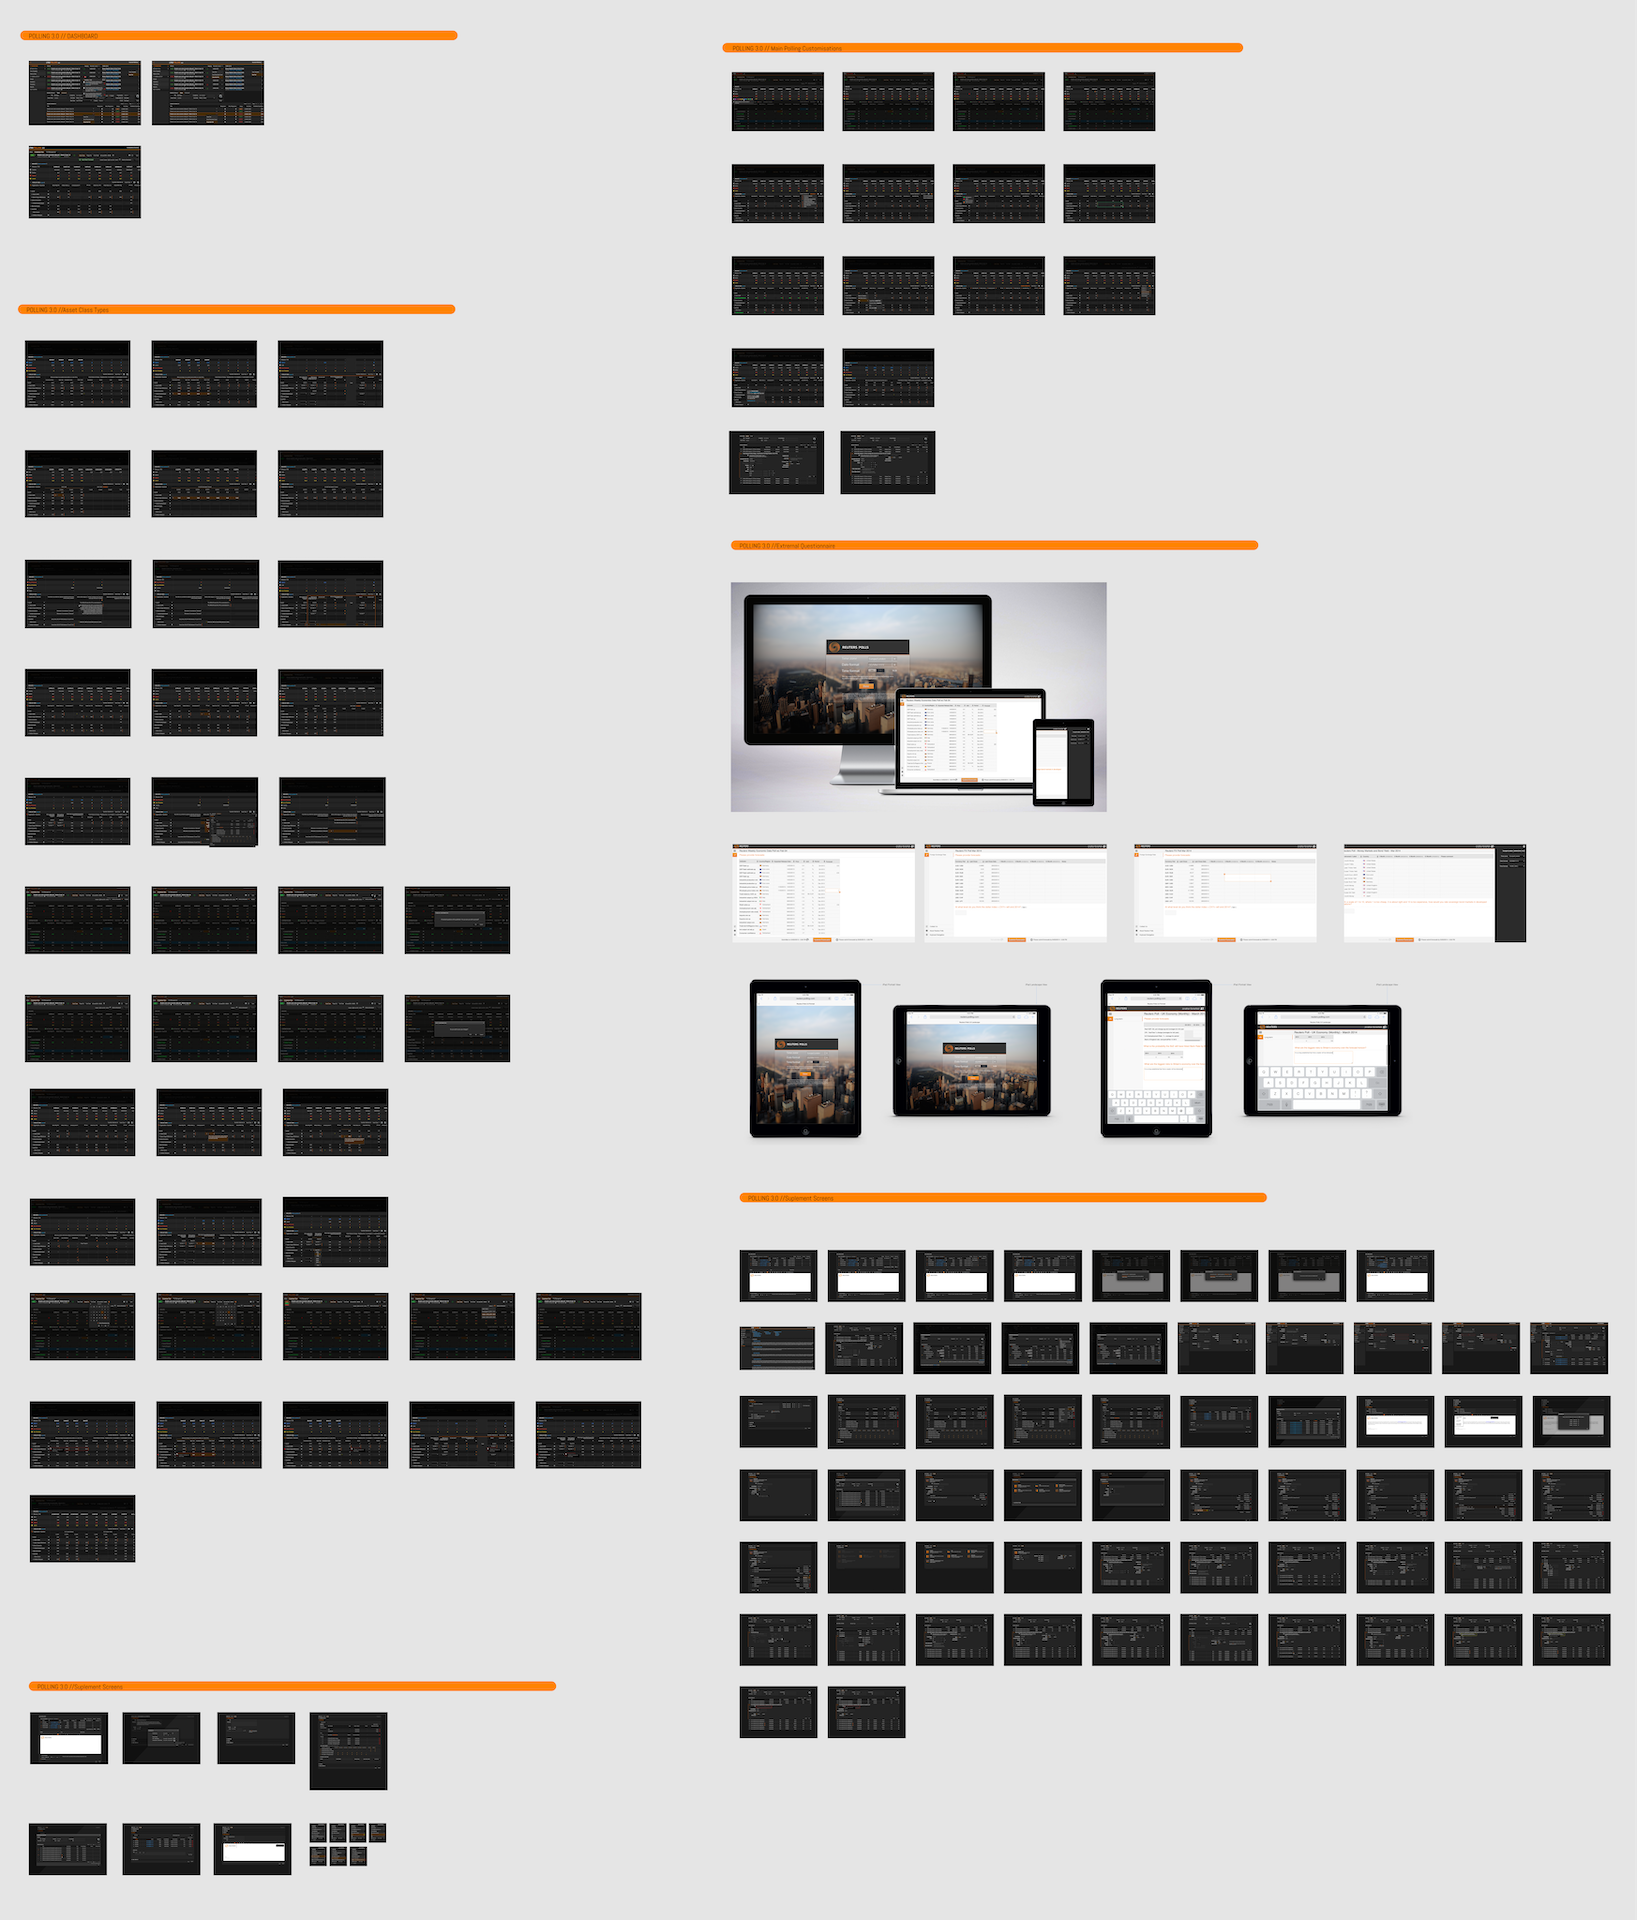
I experimented with a multitude of different styles. I created wizard-type flows, dashboard-esque screens, and much more. Despite much inspiration however, I decided to use an existing at that time design system to construct the UI. Finally, after a few weeks of iterations, I landed on a style that I and the users were comfortable and happy with. Here are some of the final designs:


Outcomes & Lessons Learned
After many weeks of work the team released the final version. which is still used as the main Thomson Reuters Polls creation tool. 6 months after the final release I revisited the project. Since it's launch the system had a 90% increase in forecast data published directly from the system, a 200% increase in economist participation and a 50% decrease in time for the team to run polls. Those were some staggering results the surpassed my original targets.
One of the hardest part of this project was the ability to structure the sheer amount of complexity on the types of polls that can be created. If I could go back I would revisit certain aspects that would ease even further the creation, such as automations and/or AI based polls interacting and validating directly with the journalists.
Despite that I still consider this project a major success and one of the most fun and challenging projects I have worked so far.
Would like to see and know more about this project?